

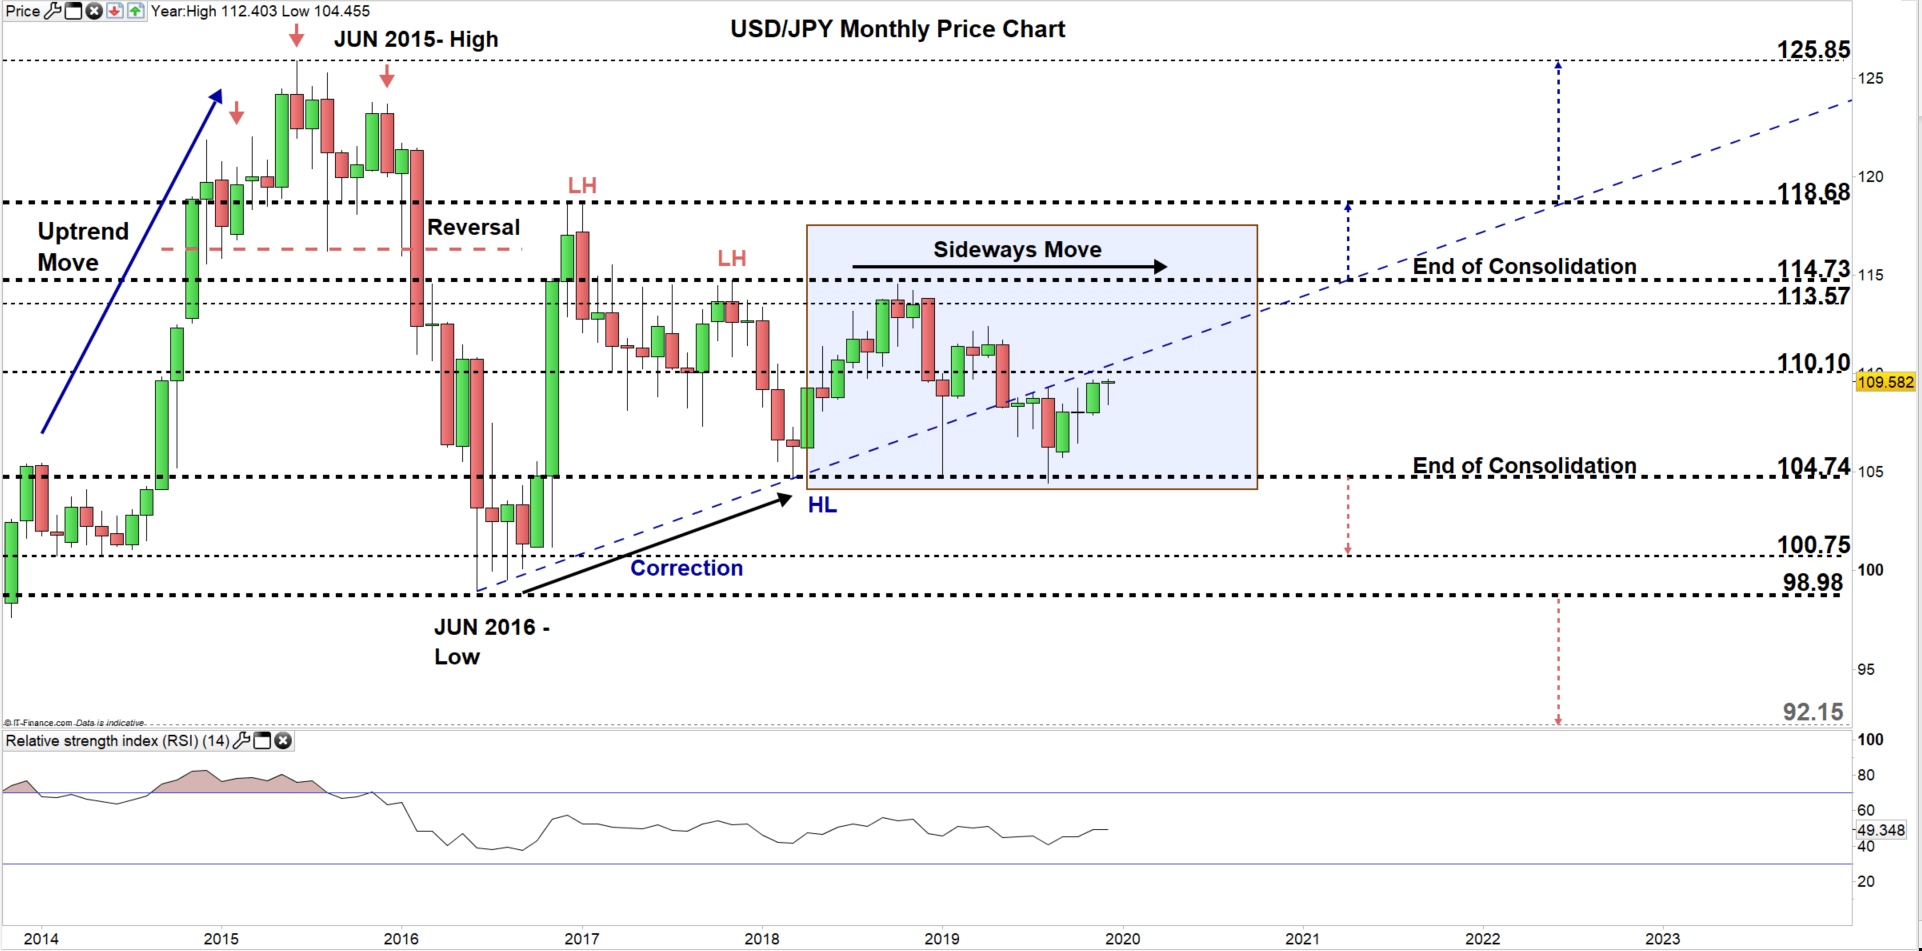
In mid-2015, uptrend move led USD/JPY to 125.85. In Q1-16, the price broke below the neckline of the head and shoulders pattern located at 116.25. This started a downtrend move and led the pair in mid-2016 to 98.98 – its lowest level in nearly three years. The price rallied after as sellers exited the market however, continued creating lower highs.
USD/JPY Monthly Chart
USD/JPY - Trendless Move
Looking at the monthly chart, we notice that by the end of Q1-18, USD/JPY corrected its downside move and created a higher low at 104.63. Since then, the pair has consolidated trading in a rough 1000 pips range. Therefore, the price would need a break above 114.73 or below 104.74 to end current sideways move.
Written By: Mahmoud Alkudsi
Please feel free to contact me on Twitter: @Malkudsi