

- Gold price breakout targets trend resistance near 2019 highs – constructive above 1500
- Check out latest projections in our Free DailyFX Gold Trading Forecasts
- Join Michael for Live Weekly Strategy Webinars on Mondays at 12:30GMT
Gold prices have surged more than 7.3% off the November lows with the rally taking XAU/USD back towards the 2019 stretch highs. While the broader outlook remains constructive, the immediate advance may be vulnerable as price approaches technical extremes near trend resistance early in the month. These are the updated targets and invalidation levels that matter on the XAU/USD weekly chart.
New to Gold Trading? Get started with this Free How to Trade Gold -Beginners Guide
Gold Price Chart - XAU/USD Weekly
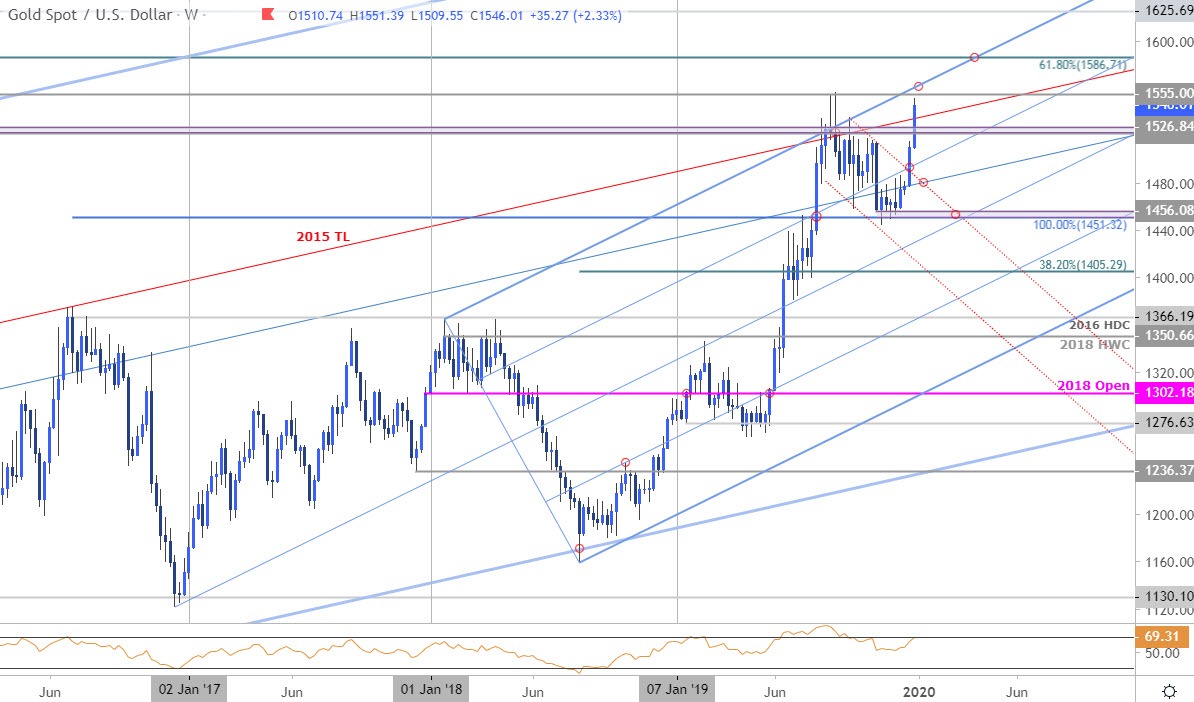
Chart Prepared by Michael Boutros, Technical Strategist; Gold on Tradingview
Notes: In last month’s Gold Price Weekly Outlook we noted that the recent sell-off had taken XAU/USD into a critical support zone, “at 1451/56- a region defined by the November low-close and the 100% extension of the 2015 advance.” Gold held this key barrier into the close of the year with the subsequent breakout now stretching back towards 2019 highs.
The immediate focus is on 1555 backed closely by the upper parallel of the ascending pitchfork formation we’ve been tracking off the 2016 / 2018 lows (currently ~1566). A topside breach / close above is needed to keep the broader long-bias viable targeting the 61.8% retracement of the 2011 decline at 1586 and 1625. Initial support rests with the 75% parallel (~1500) backed by the highlighted trendline confluence near 1480. Key support / broader bullish invalidation remains steady at 1451/56 into the start of the year.
Bottom line: The gold price breakout is now approaching targets into uptrend resistance. From a trading standpoint, look to reduce long-exposure / raise protective stops on a rally into the upper parallels – expect a more significant reaction there IF reached. Ultimately, looking for downside exhaustion on a pullback to offer more favorable entries targeting a breach to fresh highs. Review my latest Gold Price Outlook for a closer look at the near-term XAU/USD technical trading levels.
For a complete breakdown of Michael’s trading strategy, review his Foundations of Technical Analysis series on Building a Trading Strategy
Gold Trader Sentiment – XAU/USD Price Chart
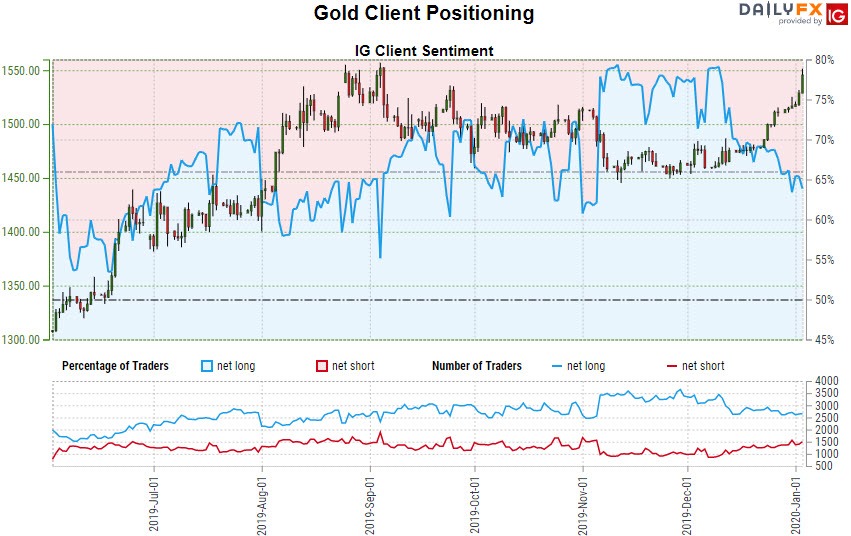
- A summary of IG Client Sentiment shows traders are net-long Gold - the ratio stands at +1.88 (65.26% of traders are long) – bearish reading
- Long positions are0.65% lower than yesterday and 3.19% lower from last week
- Short positions are2.41% lower than yesterday and 6.67% higher from last week
- We typically take a contrarian view to crowd sentiment, and the fact traders are net-long suggests Gold prices may continue to fall. Yet traders are more net-long than yesterday but less net-long from last week and the combination of current positioning and recent changes gives us a further mixed Gold trading bias from a sentiment standpoint.
---
Previous Weekly Technical Charts
- US Dollar Index (DXY)
- Euro (EUR/USD)
- Canadian Dollar (USD/CAD)
- Australian Dollar (AUD/USD)
- Crude Oil (WTI)
- New Zealand Dollar (NZD/USD)
--- Written by Michael Boutros, Technical Currency Strategist with DailyFX
Follow Michael on Twitter @MBForex
https://www.dailyfx.com/forex/education/trading_tips/daily_trading_lesson/2017/10/20/Foundations-of-Technical-Analysis-Building-a-Trading-Strategy-MB.html?ref-author=Boutros?