
GBP/USD Technical Forecast
- British Pound price action against US Dollar.
- GBP/USD charts and analysis
Download for free our latest Q4 trading guidesto help you build confidence when you trade on JPY, USD and other main currencies
GBP/USD – From Bullish to Sideways
Since the end of last week, GBP/USD uptrend move has been losing momentum. Buyers could not retest 1.3000 handle on one hand, nor they were successful to overtake the Oct 30 high at 1.2976 on the other. This resulted with a sideways move and a reversal may be on the way to happen.
Alongside this, the Relative Strength Index (RSI) declined from 68 to 59 highlighting weaker uptrend impulse.
Just getting started?See our Beginners’ Guide for FX traders
GBP/USD DAILY PRICE CHART (Nov 1, 2017 – Nov 7, 2019) Zoomed out

GBP/USD DAILY PRICE CHART (June 1 – Nov 7, 2019) Zoomed IN
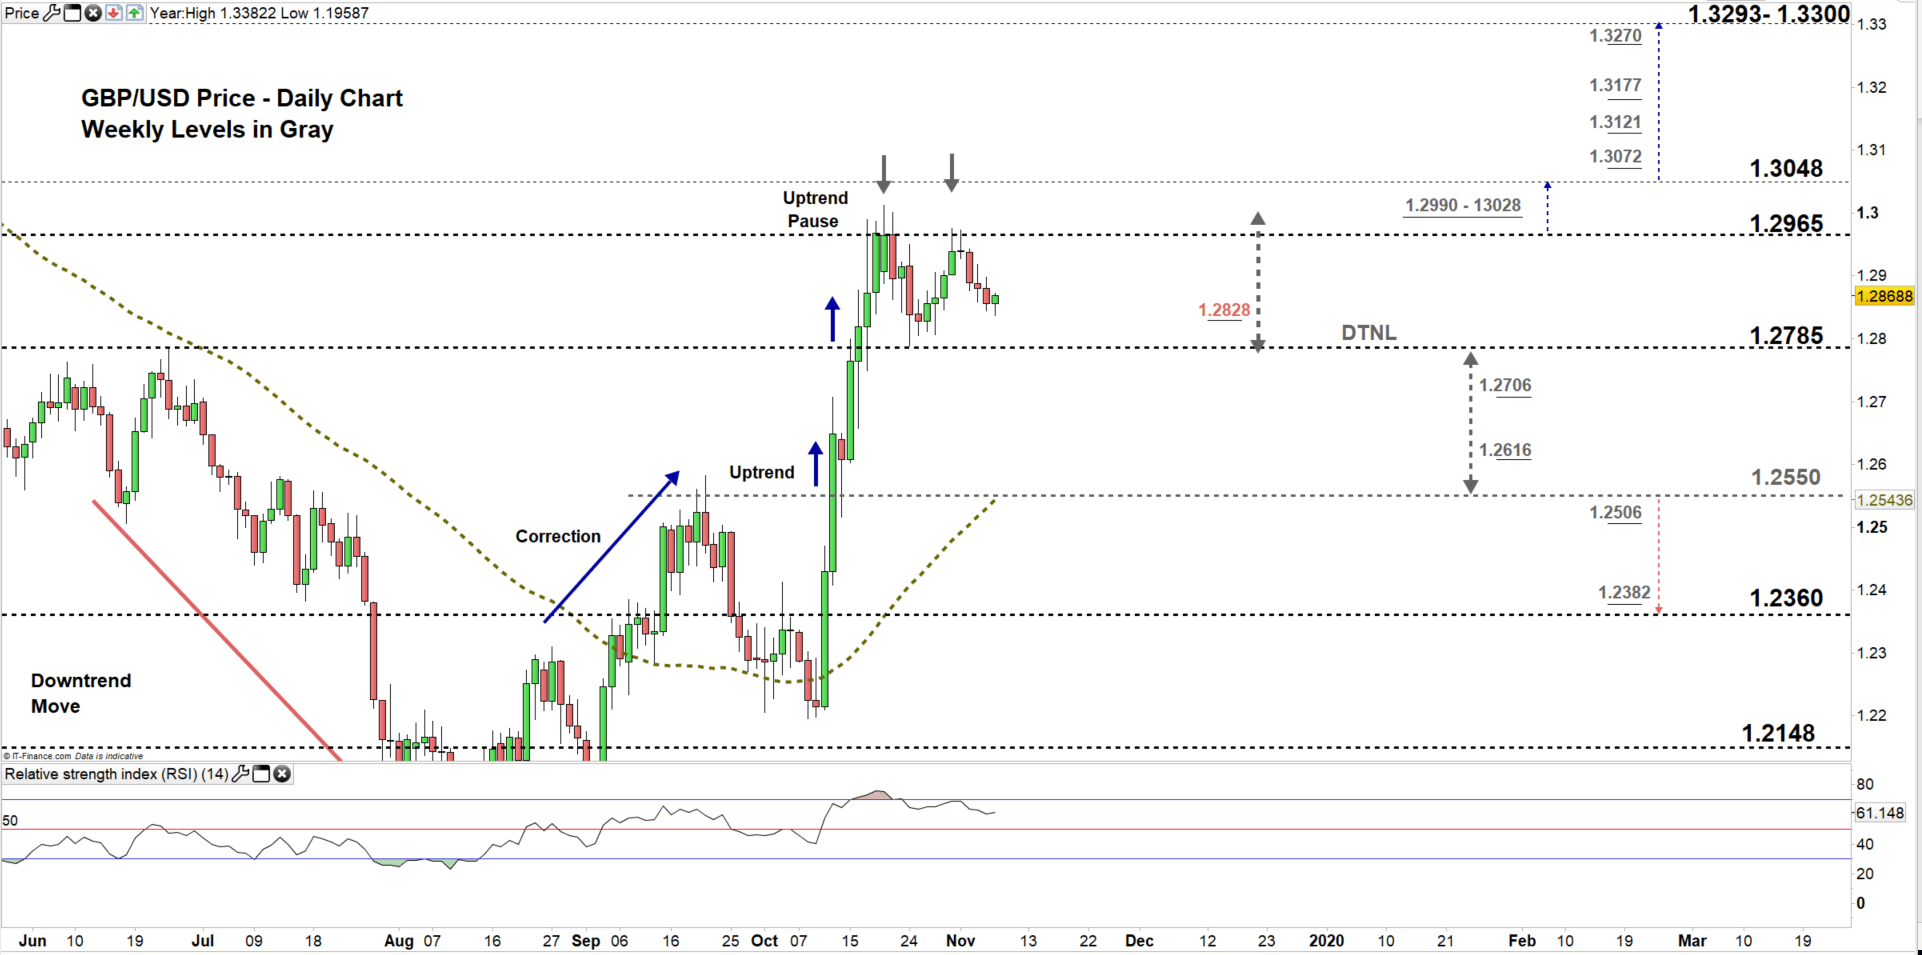
From the daily chart, we notice on Oct 30, GBP/USD rebounded nearby the high end of current trading zone 1.2785- 1.3048. Later, the price pointed lower creating a double top pattern where the neckline resides at the low end of the zone as discussed in last week update.
This suggests that if the price breaks and remains below the low end of the zone , it would press towards 1.2550. Further close below this level could see GBPUSD trading even lower towards 1.2360. Nevertheless, the daily and weekly support levels underlined on the chart (zoomed in) should be watched closely.
That said, if sellers fail in forcing a close below the low end of the zone, this could cause GBPUSD to continue its sideways move i.e. pullback towards the high end of the zone.
Having trouble with your trading strategy? Here’s the #1 Mistake That Traders Make
GBP/USD Four Hour PRICE CHART (Oct 1 – Nov 7, 2019)

Looking at the four-hour chart, we notice on Friday GBP/USD U- turned and traded lower creating the second top of double top pattern discussed above on the daily chart.
Thus, sellers could end current sideways move if GBPUSD breaks below 1.2706. This could lead the price towards 1.2616. Although, the weekly support level underscored on the chart should be considered.
On the flip-side, buyers could end current sideways move with a break above 1.3028 hinting towards 1.3072. In that scenario, the weekly resistance level marked at 1.3048 should be monitored.
See the chart to find out more about key levels GBPUSD would encounter in a further bearish /bullish scenario.
Written By: Mahmoud Alkudsi
Please feel free to contact me on Twitter: @Malkudsi