
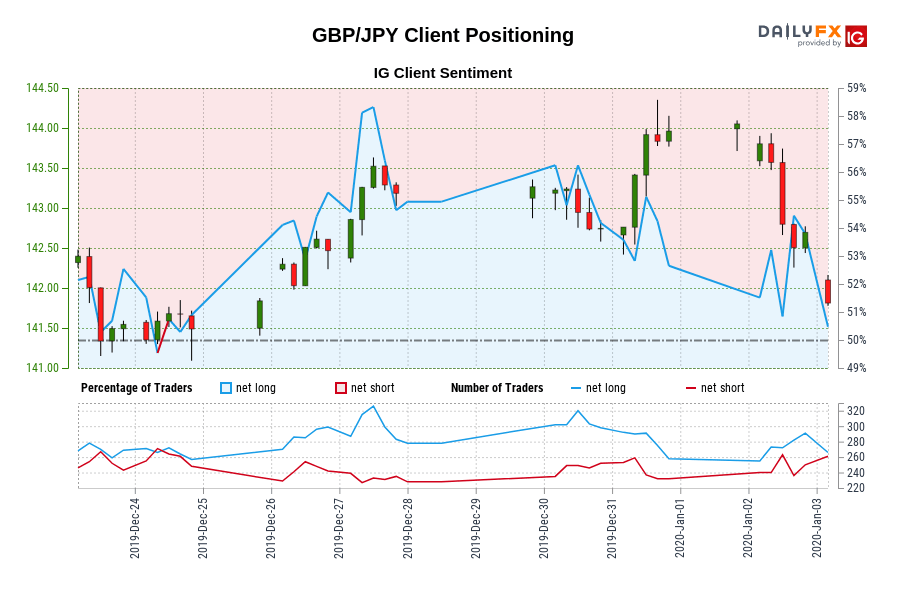
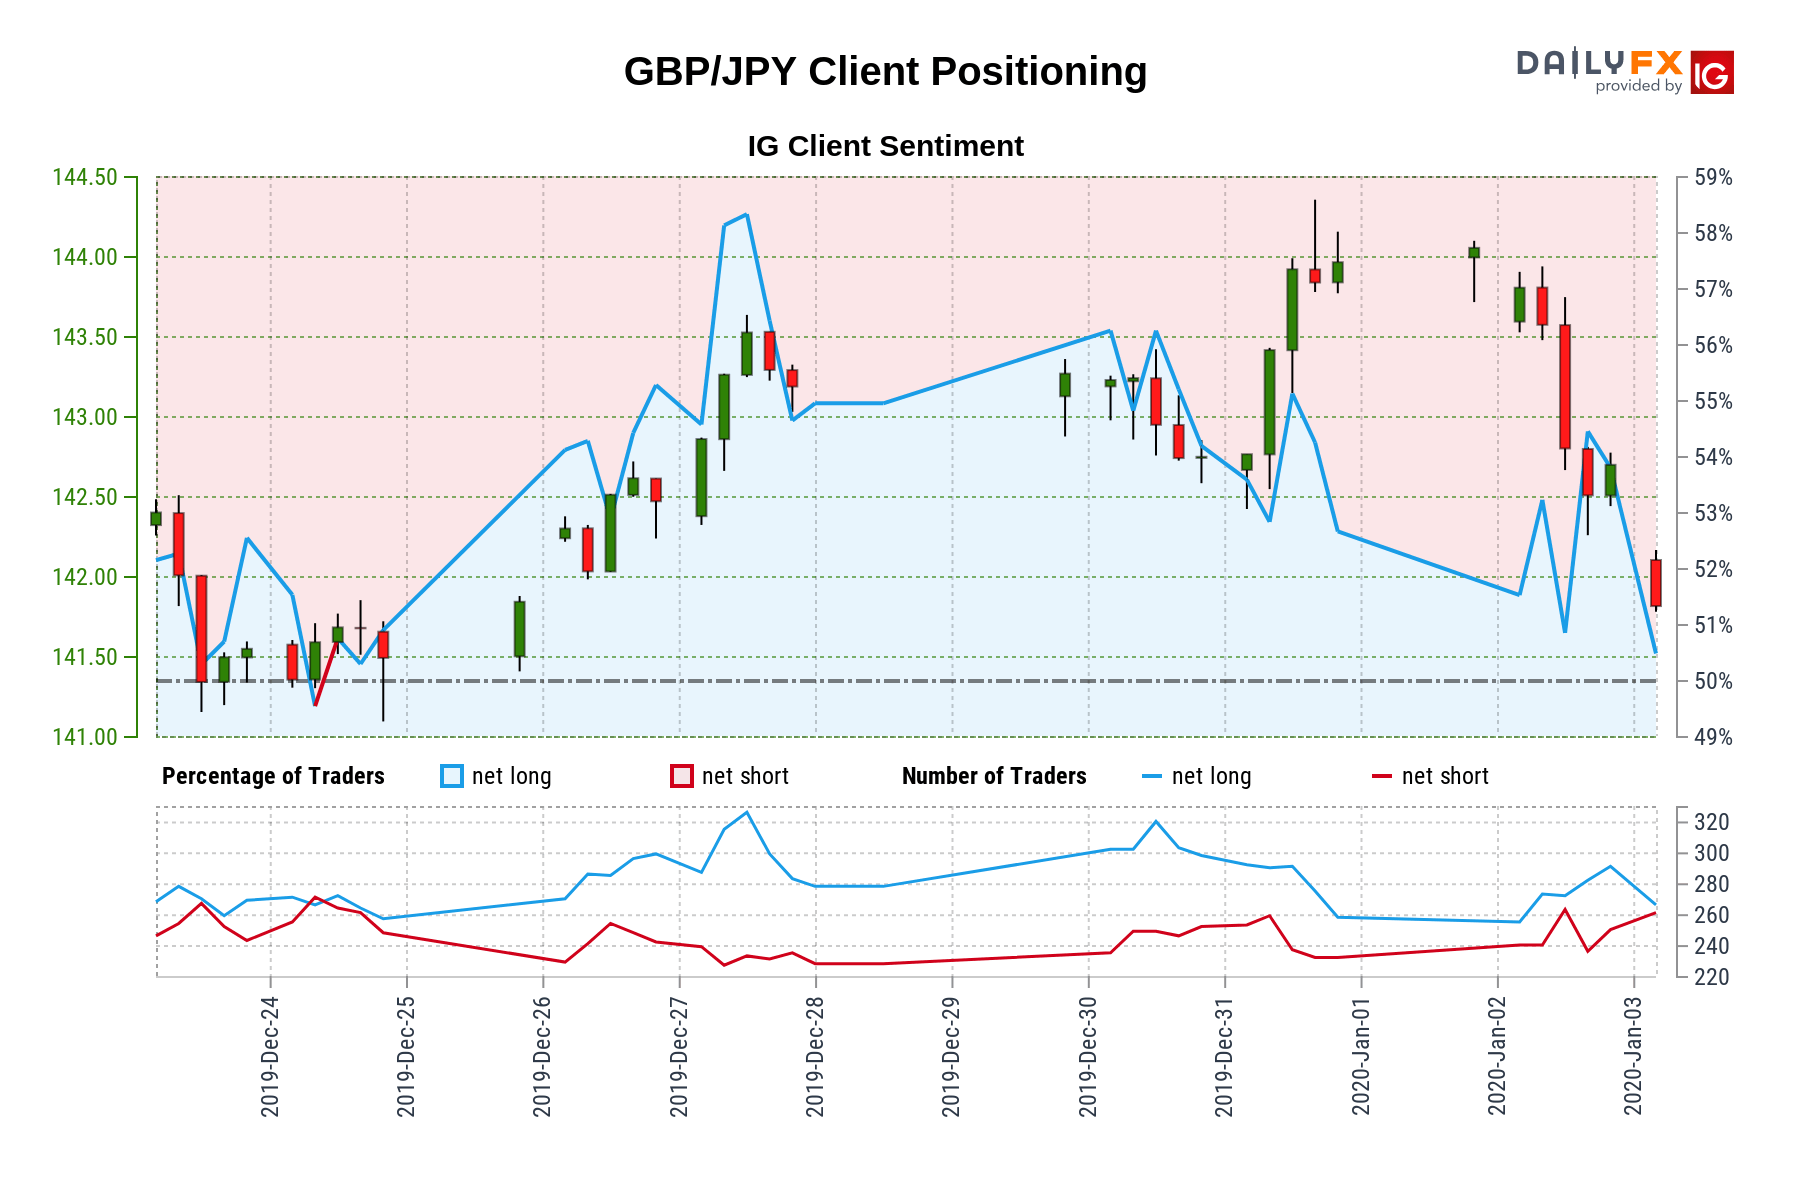
SYMBOL | TRADING BIAS | NET-LONG% | NET-SHORT% | CHANGE IN LONGS | CHANGE IN SHORTS | CHANGE IN OI |
BULLISH | 49.81% | 50.19% | 0.76% Daily -9.59% Weekly | 9.92% Daily 12.24% Weekly | 5.16% Daily 0.19% Weekly |
GBP/JPY: Retail trader data shows 49.81% of traders are net-long with the ratio of traders short to long at 1.01 to 1. In fact, traders have remained net-short since Dec 24 when GBP/JPY traded near 141.49, price has moved 0.23% higher since then. The number of traders net-long is 0.76% higher than yesterday and 9.59% lower from last week, while the number of traders net-short is 9.92% higher than yesterday and 12.24% higher from last week. We typically take a contrarian view to crowd sentiment, and the fact traders are net-short suggests GBP/JPY prices may continue to rise. Our data shows traders are now net-short GBP/JPY for the first time since Dec 24, 2019 11:00 GMT when GBP/JPY traded near 141.49. Traders are further net-short than yesterday and last week, and the combination of current sentiment and recent changes gives us a stronger GBP/JPY-bullish contrarian trading bias.