
EUR/USD Technical Forecast
See Our latest trading guides for free and discover what is likely to move the markets through Q4 of this year.
EUR/USD – Weak Uptrend
On Oct 31, EUR/USD rallied to 1.1175. Since then uptrend move paused and has not been able to overtake this threshold. On Friday, the weekly candlestick closed with a 0.7% gain. However, this week the price could not maintain any of this gain, highlighting market’s indecision at this stage.
The Relative Strength Index (RSI) dropped this week from 60 to 50 reflecting buyer’s loss of momentum.
Having trouble with your trading strategy? Need a hand? Here’s the #1 Mistake That Traders Make
EUR/USD Daily PRice CHART (Mar 31, 2017 – Nov 6, 2019) Zoomed Out

EUR/USD Daily Price CHART (July 3 – Nov 6, 2019) Zoomed in

Looking at the daily chart, we notice yesterday, the price tested the neckline of double top pattern residing at 1.1073. This suggests if the pair breaks and remains below the neckline, it could press towards 1.0963.
Currently, EURUSD moves in the same old trading zone entered on Oct 17 (1.1060 – 1.1215). A close below the low end could lead the price towards 1.0912. Although, the weekly support levels underlined on the chart (zoomed in) should be kept in focus.
That said, if EURUSD fails in closing below the low end this could mean more of the same. i.e. more of the current sideways move towards the high end of the zone. Nevertheless, the daily and weekly resistance levels underscored on the chart should be watched closely.
Just getting started? See our Beginners’ Guide for FX traders
EUR/USD four Hour Price CHART (SEp 13 – Nov 6, 2019)
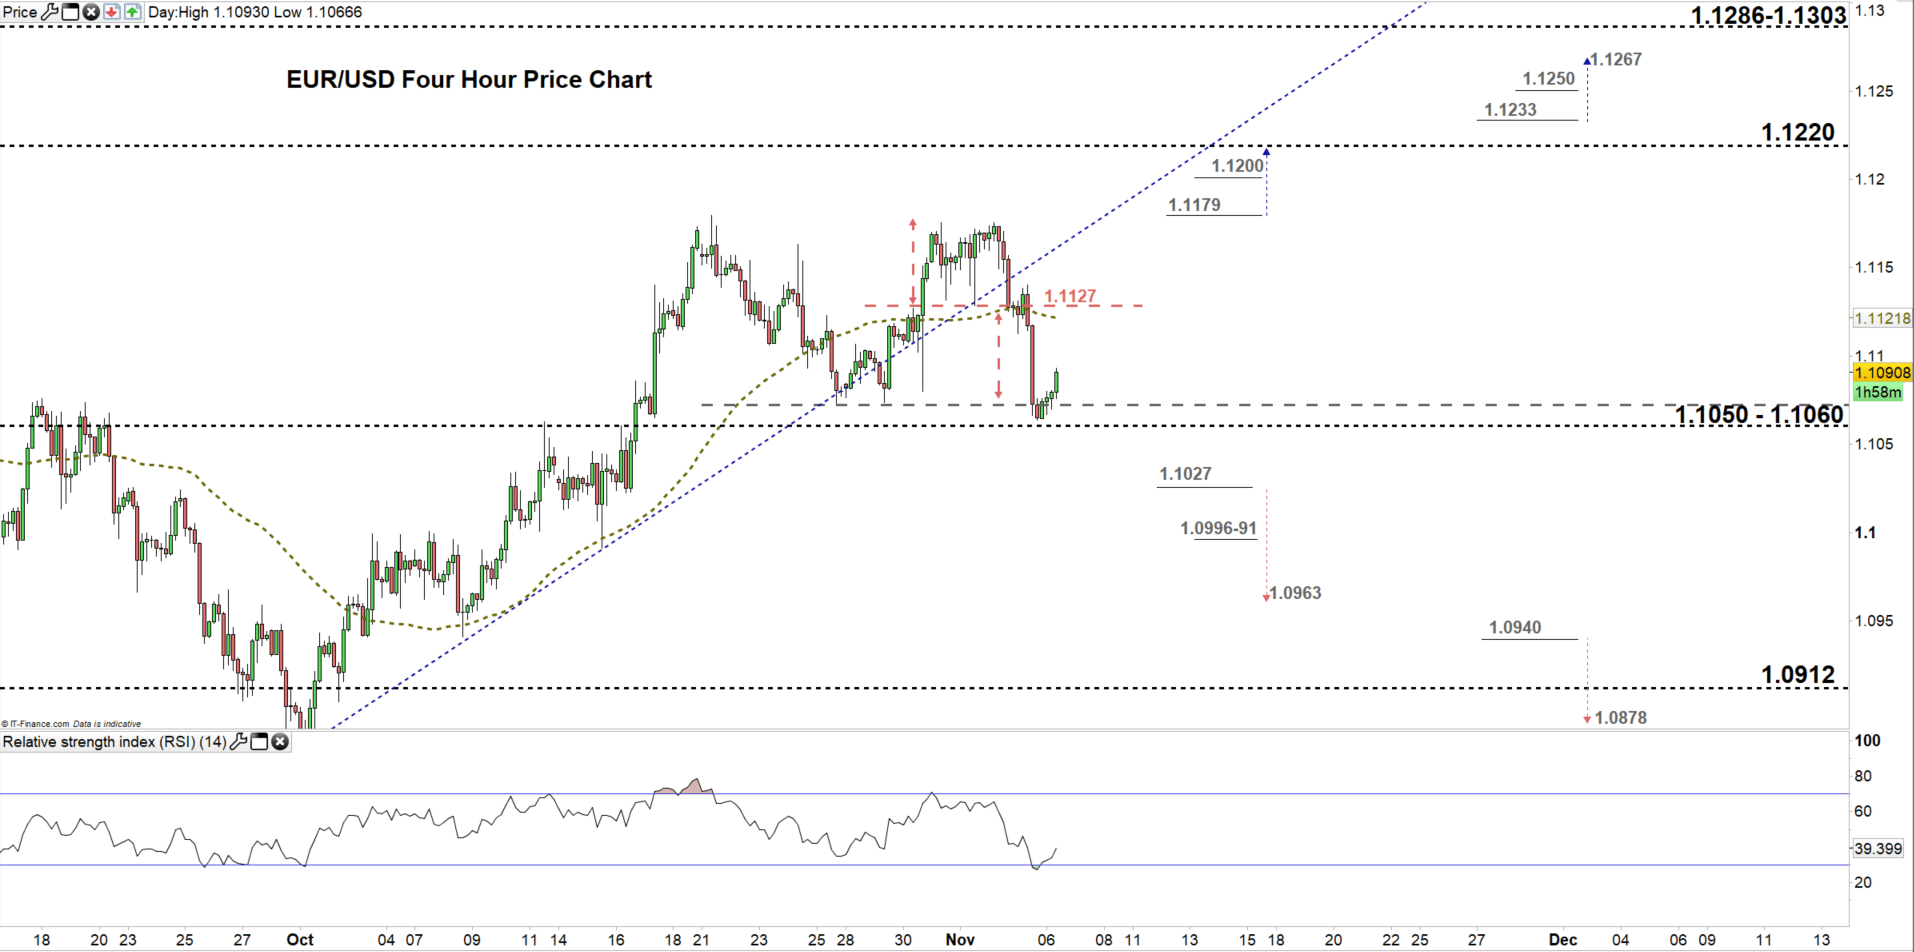
From the four-hour chart, we notice on yesterday EUR/USD broke below 1.1127 and targeted the neckline of double top pattern mentioned discussed above on the daily chart. However, sellers pulled back before testing the low end of current trading zone.
Thus, sellers could end current sideways move if EURUSD breaks below 1.1027. This could lead the price towards 1.0963. Although, the weekly support area marked on the chart should be monitored.
On the other hand, buyers could end current sideways move with a break above 1.1179 hinting towards the high end of the zone. In that scenario, the weekly resistance level at 1.1200 handle should be considered.
See the chart to know more about key levels the price would encounter in a further bullish/ bearish move.
Written By: Mahmoud Alkudsi
Please feel free to contact me on Twitter: @Malkudsi