
EUR/USD TECHNICAL ANALYSIS: BEARISH
- Euro recovery puts prices back at October swing high
- Cautious signs of ebbing momentum hint at double top
- Actionable short trade setup confirmation still pending
Get help building confidence in your EUR/USD strategy with our free trading guide!
The Euro has recovered to trade near its monthly peaks against the US Dollar once again having found support in the 1.1069-76 inflection region. The appearance of a Doji candlestick ahead of resistance in the 1.1183-89 area – marked by the October 18 high and the 38.2% Fibonacci expansion – speaks to indecision, suggesting the pair may not muster the wherewithal for a breakout.
A turn lower that puts prices back below 1.1069 on a daily closing basis would violate the bounds of the near-term uptrend and set the stage for resumption of the long-term downtrend. The 1.10 figure lines up as next downside inflection point thereafter.Alternatively, a break higher exposes the next topside barrier at 1.1225, the 50% Fib level.
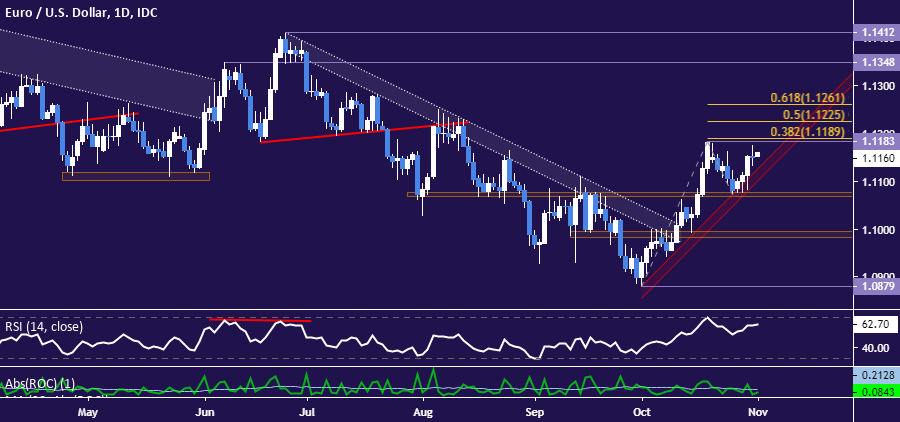
Daily EURUSD chart created in TradingView
Zooming in to the four-hour chart reveals early signs of negative RSI divergence. While this might mean little beyond near-term consolidation before another foray upward, it might likewise mark the beginning of a more substantive loss of bullish momentum. In turn, this might develop into a reversal. Pushing below resistance-turned-support in the 1.1063-71 zone seems like a prerequisite for follow-through.
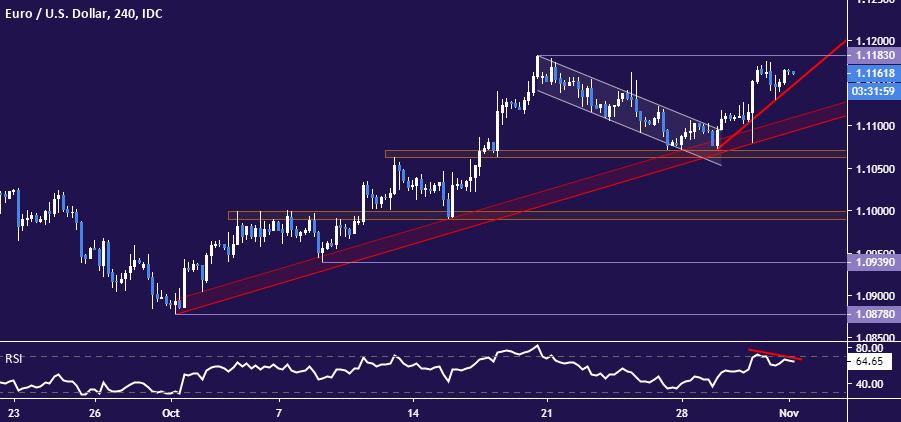
4-hour EURUSD chart created in TradingView
EUR/USD TRADING RESOURCES
- Just getting started? See our beginners’ guide for FX traders
- Having trouble with your strategy? Here’s the #1 mistake that traders make
- Join a free webinar and have your questions answered
--- Written by Ilya Spivak, Currency Strategist for DailyFX.com
To contact Ilya, use the comments section below or @IlyaSpivak on Twitter