

Crude Oil Technical Forecast: Bearish
- Crude oil prices climbed in most aggressive week seen since over a month ago
- The commodity lacks a clear direction for this year, unchanged from February
- Near-term oil technical signals hint prices may turn lower in the week ahead
Build confidence in your own Crude Oil trading strategy with the help of our free guide!
Crude Oil Technical Outlook
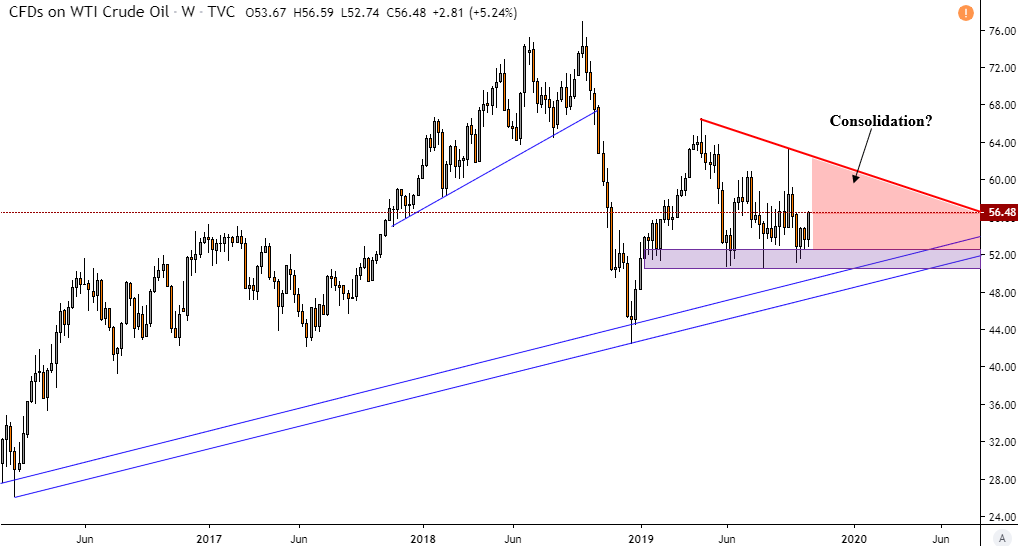
WTI crude oil prices climbed more than 5.3 percent this past week, making for the best 5-day performance in over a month. Yet, in the long run, the commodity finds itself practically unchanged from where prices were almost 9 months ago back in February. We can see this clearly on the weekly chart. WTI Crude has spent most of this year consolidating, failing to find a clear trend.
I can from a technical standpoint argue that oil is and has been in a cautious uptrend since prices bottomed back in February 2016. Since then, the rising channel of support has been guiding the commodity higher – parallel blue lines on the chart below. Focusing on 2019 price action, it seems that there is much progress still needed to break out of persistent consolidation – red area on the chart.
Read my Crude Oil fundamental forecast to learn about event risk facing the commodity this week!
Crude Oil Weekly Chart
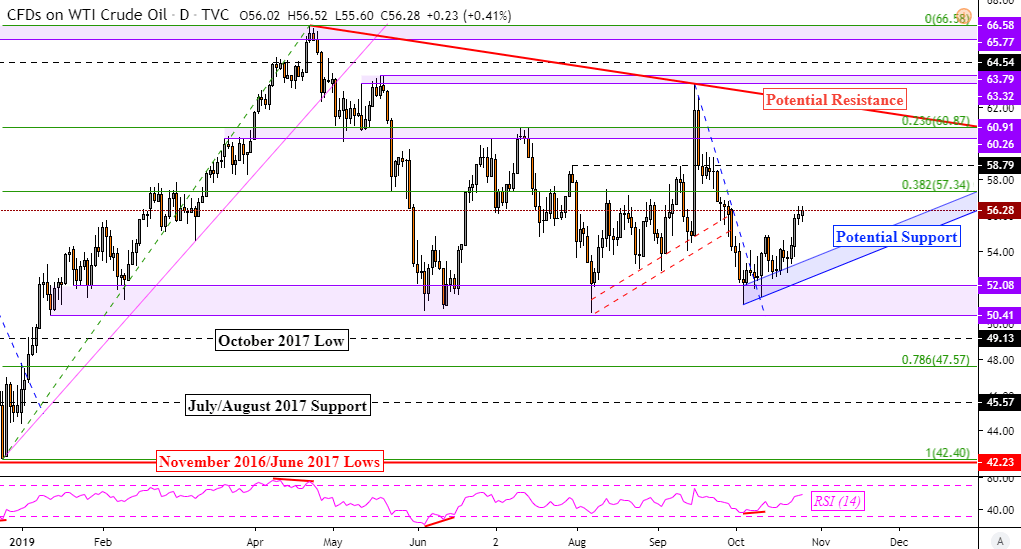
In the week ahead, the push higher could pave the way for a test of the 38.2 percent Fibonacci retracement at 57.34. Closing above it opens the door to facing 58.79 which is the late-July peak. Guiding oil higher appears to be a potential rising channel of support from earlier this month – blue area on the daily chart below. Recent gains occurred after a failed attempt to clear the critical support range at 50.41 to 52.08.
For there to be a significant technical breakthrough, I would argue that we would either need a push above potential descending resistance from April – red line below. Or, a close under the aforementioned key support area. The former opens the door to resuming the dominant uptrend from 2016 while the latter would likely pave the way for a retest of the rising channel from then.
For more updates on crude oil, including fundamental developments, feel free to follow me on Twitter here @ddubrovskyFX.
Crude Oil Daily Chart
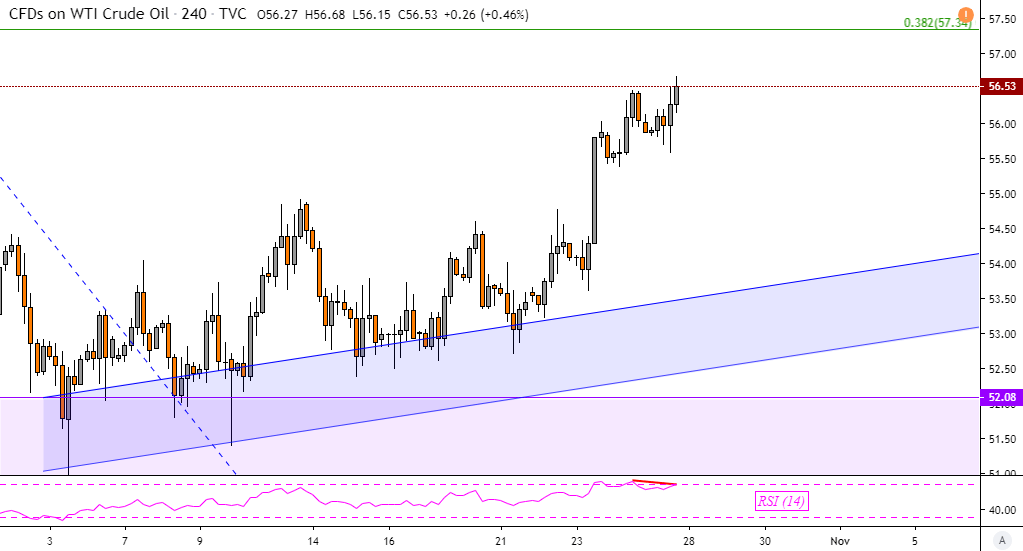
Zooming in on the 4-hour chart, there does appear to be an early warning signal that crude oil could turn lower in the week ahead. We do have the presence of negative RSI divergence, indicating fading upside momentum. At times, this can precede a turn lower or translate into consolidation. Past performance is not necessarily indicative of future results. Still, a drop ahead places the focus on rising support.
Crude Oil 4-Hour Chart
Crude Oil Charts Created in TradingView
FX Trading Resources
- Having trouble with your strategy? Here’s the #1 mistake that traders make
- See how crude oil is viewed by the trading community at the DailyFX Sentiment Page
- Just getting started? See our beginners’ guide for FX traders
--- Written by Daniel Dubrovsky, Currency Analyst for DailyFX.com
To contact Daniel, use the comments section below or @ddubrovskyFX on Twitter